Starter’s Guide to Mitigate Fraud Using Policy Manager
September 13th, 2023

Many financial institutions (FIs) struggle to mitigate fraud thanks to multiple systems that score it, various account monitoring processes, and how they must integrate data to sweep for issues. The fix is having a single tool that enables leveraging all data. Having this toolset helps FIs join the outputs of various systems employed in fraud mitigation into a single data source and use that data to mitigate issues in real time. Unique to NICE Actimize’s solution, you can manage all issues in one system, record all fraud findings in one place, and use every bit of the intelligence gathered on a go-forward basis.
Once the installation is complete, the Investigations Database will eventually be filled with nearly every transactional detail, enriched with contextual information from the accounts involved in the transactions. Like any large-scale integration project, there is always a great deal of pressure to show early returns on investment. After just a few months, there is a potential to save millions—but what about the short term?
In my role as an Actimize business analyst, I speak to clients every day who are in this circumstance: How are they going to leverage their new solution, right out of the gate, to show proven returns? This is what one FI did.
Leverage Data
This FI had Regulation E dispute claims, which led to them needing to pay out against dispute claims. They chose Actimize’s Card solution to stop transactions with features that correlated with later disputes. The process started with isolating the transaction key values for the disputed transactions over the last 90 days before go-live. To this, other transactions tied to various loss events were added, including transactions that drove accounts into the negative where transactions could have been declined if the client had known they were going to go badly.
The client created a unified list of all the preventable fraud that could be found. The result was a staged database that contained:
- Transactional data, for all transactions, in the format they would appear within the IDB upon full implementation
- All preventable fraud transactions, evaluable against all transactions
Once the Actimize solution was implemented, they’d have access to create Policy Manager rules. Because they were able to choose the data elements which would be available to Policy Manager, the triggering conditions to use were known and they had a place to start. The next step was assessing transactions. What makes a transaction risky? What qualifies as a transaction they would want to interdict?
ISO messages contain a lot of information. For example, the PAN Entry Mode for each transaction can tell stakeholders exactly how the PAN was entered. There are merchant locations, Merchant Category Codes, etc. Using that sort of data to judge risk can be simple.
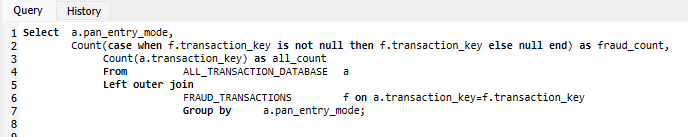
The output of a query like this would show each PAN Entry Mode, a count of the fraudulent transactions aggregated by PAN Entry Mode, and a count of all transactions during the period, also aggregated by PAN Entry Mode. The simple operation of fraud count/all count provides a straightforward, odds-based risk assessment. This can be augmented with a count of distinct customers, a count of distinct cards, sums, and other metrics.
Transform Your Data
Past the plethora of field values one can use to gain straightforward judgments of risk, there are many data elements that resist easy aggregation. An example is amount. While the value has a clear definition, the cardinality of amounts is high, and judging the risk of one penny versus. two is a bit picky. After initial observations to judge where risk lies on a dollar scale, one can create a classifier to speed things along. A classifier is anything one can use to create a lower-cardinality description of underlying transactions for the purposes of aggregation. For example, if risk on a card transaction starts to rise at $100, this SQL classifier is useful:
If certain geographies are riskier, one might deal with the cardinality of merchant zip codes like this:
The possibilities are numerous. Is the transaction outside the FI’s primary country? Is the transaction outside the customers’ state of residence? Is the transaction occurring on a high-risk Merchant Category Code? Does this transaction occur on a new account? Does the customer performing this transaction have multiple banking products? Has the account recently received a large deposit?
The Right Combination of Details Mitigates Risk
Right now, these are a few basic observations using simple econometrics. It’s easy to see what classifiers correlate with risk and how strong the correlation is. However, it’s not advisable to block entire countries (unless warranted) or whole PAN Entry Modes. And it’s not necessary to review everything over $100—only those items that will yield a good false positive rate and a decent amount of return for the time spent working on it.
When these details are brought together to consider what combinations of them will correlate with enough risk to be worthwhile, the result is many combinations that don’t need evaluation because they don’t meet basic criteria for false positive rates and other metrics. This is where a Hidden Decision Tree (HDT) comes in handy. Luckily, Oracle provides a CUBE() function that allows leveraging HDTs for our use case. For any FI without ready-to-go Python developers who know something about bank fraud too, SQL provides a “budget” HDT via this function. Assuming the goal were a by-transaction false positive rate of 7 (12.5% fraud by count), a by-amount false positive rate of 7, a by-card false positive rate of 7, and a total deflection of $5,000 in chargeback risk over the retention period…
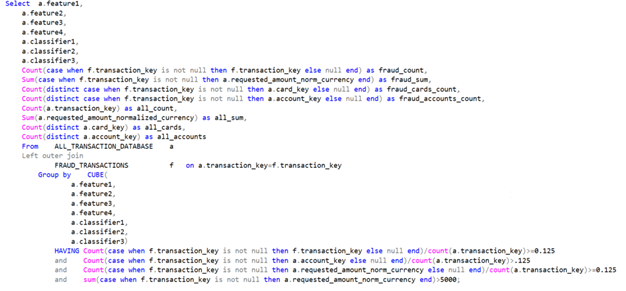
The combination of the CUBE() and HAVING clauses here will produce a HDT wherein all combinations of the features and classifiers in the SELECT clause are tried against the underlying transactions. The only prerequisite for success here is that none of the classifiers within the query can resolve to a natural null, as the CUBE() function will express a null to indicate the row in the output didn’t consider the impact of that detail. You can prevent this by knowing your data, knowing what operations might yield a null, and dealing with it. PAN Entry Mode, for example, can occasionally be passed in as a null. So…
eliminate the natural null inputs and keep them out of the HDT. A null feature/classifier in the output should mean only that the feature/classifier isn’t considered in the output for the row, within the aggregate.
The results will look something like this, but likely will contain thousands of rows depending on how many classifiers are chosen and their cardinality:

Within the output, classifiers are either:
- Known, with a value (populated)
- Unknown/not considered (null)
In the output, there are two rows that seem to address the same fraud scenario. The first row considers six elements (6 populated, 1 null). The second considers five elements. The count of non-null elements is a row’s “complexity”. The two rows address the exact same scenario based on the fact they both detect the same number of cards and accounts, and the same exact amount of fraud. Here, the higher-complexity pattern describes the fraud scenario with fewer false positives (lower total counts, same fraud counts). So, the lower-complexity row can be eliminated.
If FEATURE1 is the CARD_PRESENCE_IND, FEATURE2 is the CARDHOLDER_PRESENCE_INDICATOR_CD, FEATURE4 is a Boolean value based on an indicator for whether track data is present, CLASSIFIER1 is a classifier based on the amount, CLASSIFIER2 is a Boolean for whether the account is aged 90 days or more, and CLASSIFIER3 is a classifier for whether a transaction is in-state to the customer, out-of-state to the customer, or foreign, now this Policy Manager Rule can be written:
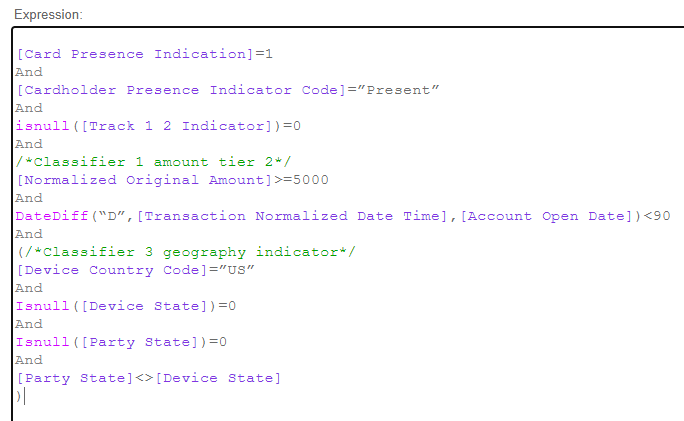
The results are already tested against the transactional data. Over that past timeframe, this rule would have produced a very acceptable number of rule hits that turned out to be fraud, out of 300 total transactions it would have interdicted. There would have been 189 accounts saved from/prevented from doing fraud, out of 275 total interdicted.
Increase Rule Production and Maintenance Efficiency
Here’s another example: Eliminating high risk merchants with few non-fraud transactions. Using the same HDT query method, above, can produce a list of merchants that it’s riskier to do business with, due to the chargeback or fraud rate being much too high.
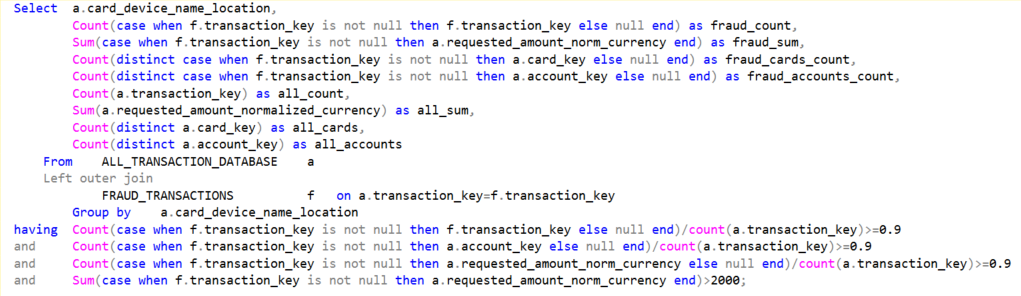
This single query might return a few hundred merchants that can be blocked, based on the name value alone. Typing this out into a Policy Manager Rule might get a bit cumbersome, especially if you plan on re-running the query periodically to refresh the merchant blacklist. One solution is a Platform List. Another is to place this HDT as the inner query, where this is the outer query:
Minus the metrics, the output to the first column will be something like this…
|
([Device Name Location]=“JIMMYS FRAUD SHACK LA CAUS”) or |
|
([Device Name Location]=“FACTORING MERCHANT SMITHTOWN WAUS”) or |
|
([Device Name Location]=“THEFT INC STOCKTON CAUS”) or |
|
([Device Name Location]=“BAD MERCHANT 1234 WALLA WALLA WAUS”) or |
|
([Device Name Location]=“I TEST CARDS FOR FRAUD GREENVILLE NCUS”) or |
|
([Device Name Location]=“FAKEMERCHANT COPPERVILLE GAUS”) or |
|
([Device Name Location]=“WWW.FRAUDY.COM GAUS”) or |
|
([Device Name Location]=“GOMERS AUTO SHOP AND FRAUDS GINVILLE SCUS”) or |
|
([Device Name Location]=“SHERYLS HOUSE O FRAUD SHERYLVILLE GAUS”) or |
|
([Device Name Location]=“WWW.ELECTRONICSFRAUD.COM LA CAUS”) or |
|
([Device Name Location]=“SMITHS THIEF BARN SMITHVILLE NEUS”) or |
|
([Device Name Location]=“EXPLOSIVES-R-US NY NYUS”) or |
|
([Device Name Location]=“ONLINE DRUGSTORE FRAUDVILLE DEUS”) or |
|
([Device Name Location]=“CASHAPP*SARAHSTEALSSTUFF CAUS”)… |
This, of course, will fit quite well into a shell rule like this, in Policy Manager. If the list gets quite lengthy, you’d change the format and place the output in a Platform List instead. If it’s short, though, this is acceptable:
(/*Rule Conditions*/
|
([Device Name Location]=“JIMMYS FRAUD SHACK LA CAUS”) or |
|
([Device Name Location]=“FACTORING MERCHANT SMITHTOWN WAUS”) or |
|
([Device Name Location]=“THEFT INC STOCKTON CAUS”) or |
|
([Device Name Location]=“BAD MERCHANT 1234 WALLA WALLA WAUS”) or |
|
([Device Name Location]=“I TEST CARDS FOR FRAUD GREENVILLE NCUS”) or |
|
([Device Name Location]=“FAKEMERCHANT COPPERVILLE GAUS”) or |
|
([Device Name Location]=“WWW.FRAUDY.COM GAUS”) or |
|
([Device Name Location]=“GOMERS AUTO SHOP AND FRAUDS GINVILLE SCUS”) or |
|
([Device Name Location]=“SHERYLS HOUSE O FRAUD SHERYLVILLE GAUS”) or |
|
([Device Name Location]=“WWW.ELECTRONICSFRAUD.COM LA CAUS”) or |
|
([Device Name Location]=“SMITHS THIEF BARN SMITHVILLE NEUS”) or |
|
([Device Name Location]=“EXPLOSIVES-R-US NY NYUS”) or |
|
([Device Name Location]=“ONLINE DRUGSTORE FRAUDVILLE DEUS”) or |
|
([Device Name Location]=“CASHAPP*SARAHSTEALSSTUFF CAUS”)… |
)
It’s expected that the bad actors will adjust. Assuming you continue to collect known fraud, when you re-run the same query, you’ll likely get a different list. So, perhaps replace the old one. To let items age out, modify your HAVING clause as desired. To allow a merchant “out” that hasn’t been problematic in the last 30 days, for example, something like this will work.
Leverage the Risk Score
- Add a score reference to Policy Manager and test it out as a standalone
- Add score references to versions of your Policy Manager Rules, to find cases where it will reduce your False Positives
- Leverage the Risk Score in classifiers
Using a score generated by Actimize enables FIs to leverage machine learning models created by Actimize Watch that consider many different risk factors at once. In this way, you can leverage the insights it would take thousands of Policy Manager Rules to describe, just by referencing the score. Using the score also allows financial institutions to build on top of the score, to target the riskiest transactions without evaluating everything.
Manual Processes Increase Errors
If all this strikes you as incredibly manual, that’s because it is. Luckily, at this FI, an entire data warehouse and analytics team was at their disposal. But this is not the case at every FI. Leaning on manual processes will be a liability. The best benefit comes when FIs implement Actimize Watch, enabling the powerful synergy of Actimize machine learning models with continuous monitoring and the FIs’ own knowledge of their transactions, customers, and known fraud scenarios.
Starting with a good idea of what to do in Policy Manager is important. This blog covers some practical ways to dive in and start with a workable rule set, in a pinch. Actimize Watch can take these “starter strategies” to the next level. Ultimately, it’s better to have the details considered by a complete machine learning model and then encapsulated in a single score. All these methods are compatible with one another and availing oneself of all of them yields the best advantage.
Want to read more about the different fraud solutions NICE Actimize has to offer? Click here.